September was a month of rising rates: the 10-year Treasury rose about 50 bp to 5.30%, and the 20- and 30-year closed near 5.70% and 5.65%, levels last seen around 2002. A hot economy, oil near $100, heavy Treasury and corporate issuance, and a Fed that resumed hiking drove the move.
The tone shifted at month-end. September payrolls came in at just 29K and an October hike was largely priced out, pulling the front end lower. The long end barely moved, and our desk expects 10-year-plus rates to stay sticky near 5% for an extended period.
For borrowers, the practical effects are already visible:
- Higher hedging costs. Rate cap premiums have doubled or tripled on some deals in a few weeks.
- Lower leverage. Typical proceeds have fallen from about 70% LTV to 60–65% in roughly 30 days.
- Rate buy-downs to make deals pencil. Buy-downs are now common, averaging 2–3 points on CMBS executions.
Our guidance: build optionality into long-dated hedges, keep cap terms short and execute early, and do not miss rate-lock deadlines.
Treasury Curve: September 1 to October 5
Every maturity from 3 months to 30 years rose, by 23 to 52 bp, with the 5- to 10-year sector up the most.
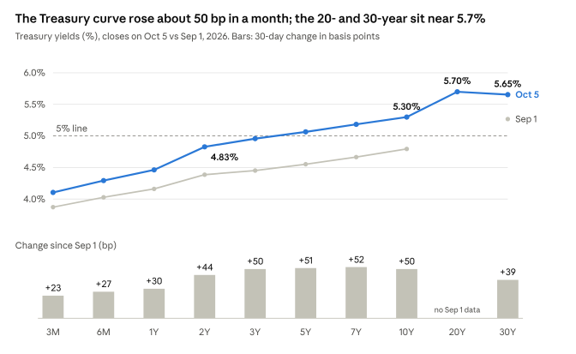
Treasury historical yield curve screen, closes 9/1/2026 and 10/5/2026. 20Y has no 9/1 reading; 4-month bill omitted.
The long end now sits at multi-decade highs. The 10-year reached about 5.34% last week, its highest since 2002, and the 20- and 30-year are also at 2002-era levels. The 5- and 7-year are above their October 2023 peaks, the highest since 2007. The 2-year is elevated but below its 2023 high, so the front end is not at a multi-decade high. Nothing on the curve is at a 25- or 30-year high.
What Drove the Market
The market repriced the Fed from pause to tightening, and oil, strong data and supply kept pressure on every maturity.
- The Fed. The FOMC raised rates 25 bp in September to a 3.75–4.00% target range, its first hike since July 2023. By late September, swaps priced nearly another full point of hikes over the next year.
- The economy. Early-month data ran hot. August payrolls were 162K, the September flash composite PMI hit 58.4 (a five-year high), and Q2 GDP was revised up to 2.2%. September then broke the pattern: payrolls were 29K, prior months were revised down, and unemployment rose to 4.2%.
- CPI is running at 3.4%, and our desk puts core and headline PCE around 3%. Wage growth slowed to 3.0% year over year, its weakest since May 2021, the one soft inflation signal.
- The Middle East conflict and Strait of Hormuz disruption kept Brent near $100. BMO measured a 0.96 correlation between front-month WTI and the 10-year in mid-September, the tightest since 2019. For now, oil is effectively setting the direction for the 10-year.
- Supply and fiscal pressure. Federal deficits are running near $2 trillion a year, Treasury plans $628 billion of Q4 borrowing, and AI-related corporate issuance is heavy. Dealer balance sheets were full going into quarter-end, and long-end buyers were scarce.
- A global selloff. Long yields rose across developed markets, so US Treasuries got little relief from foreign demand.
Desk Commentary
Hedging and Derivatives
Our hedging desk’s message is to build optionality into long-dated swaps, keep caps short, and execute without delay.
- Cancelable swaps. Embedding a 7-year call feature in a 10-year bank swap costs roughly 20 bp per annum today. With 10-year swaps near 4.80%, a later drop to about 2% short-term rates could put up to 300 bp of value in that option. Rates rose aggressively and are likely to fall aggressively at some point; the call right protects against large termination costs.
- Caps are expensive and getting more so. Dealers are pricing 6–8 bp per annum through model value because a rapid rate rise hurts their option books. In one example, cap extensions quoted at $35–40K in early September cost close to $100K three weeks later. Most borrowers are keeping cap terms as short as lenders allow.
- Do not terminate in-the-money swaps by default. Many swaps placed in the last two or three years are deep in the money. Unwinding one just to go back to floating usually destroys hedge value.
- Unless the value funds a better structure. One client had about 18 months left on a swap worth roughly $300K. Using that termination value to fund a rate buy-down on a new five-year Freddie Mac fixed-rate loan extended his fixed-rate term by about 3.5 years at little net cost.
- Ask what the bank is charging on the swap. Some lenders embed 40 bp of spread in required swaps against 20–25 bp quoted. That is equivalent to about 1.5 points on a three-year loan. Negotiate before signing the term sheet.
Securities and Agencies
Our securities desk sees long-end demand as the key risk, but wider agency spreads are creating value for defeasance portfolios.
- Weak long-end demand. Dealer balance sheets were heavy into quarter-end, many firms are not buyers, and some prominent investors are favoring T-bills near 4.5%. Nobody yet knows who will catch the falling knife on the long end.
- Agency bullets are back in play. 7-year agency tap spreads widened about 9 bp last week to levels last seen six or seven years ago. With taps in double digits over Treasuries, custom bullets for 2032–2034 maturities can again beat Treasury pricing.
- Strip 5% coupons. With 5- and 7-year Treasuries yielding about 5%, high coupons throw off excess cash for monthly-pay deals. Send Treasury portfolios carrying four to six months of cash flow (the 120-day rule) to the desk to test stripping.
Defeasance
Defeasance volume has picked up over the past 45 days, led by property sales rather than refinancings.
- Replacement financing is mostly regional bank debt and cash buyers. Agency execution has been slower than borrowers want.
- Asset mix. Multifamily and manufactured housing led over the last 30 days, followed by retail and hospitality.
- Costs. Higher Treasury yields are lowering defeasance costs, but that rarely decides a transaction on its own. Q4 typically brings a seasonal pickup.
Lending and Commercial Real Estate
Lenders are eager, but fewer deals pencil at current rates.
- Leverage has dropped quickly. Most deals now cap out at 60–65% LTV, down from about 70% roughly 30 days ago.
- Rate buy-downs are common. CMBS executions are averaging 2–3 points of upfront buy-down. In one acquisition under contract since late spring, the buyer paid about 1.25 points, just under $1M, to meet coverage and proceeds tests.
- Floating plus hedge. More borrowers prefer SOFR-based pricing with a hedge to get a lower initial coupon.
- Agency pullback. Agencies are prioritizing balance-sheet management over origination targets. Borrowers who originated in 2021–2022 are turning to debt funds and bridge lenders.
- Rate locks. Lenders will not extend locks past their deadline. Close on time.
What to Watch in October
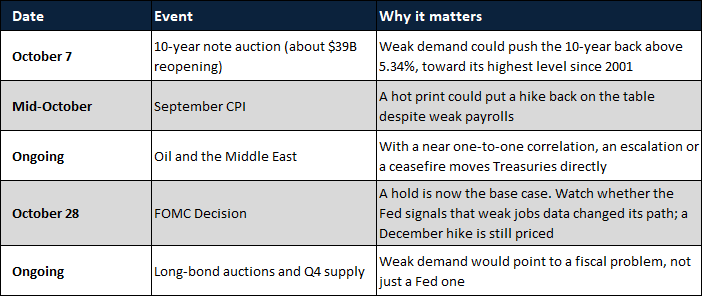
The month turns on whether weaker hiring or oil-driven inflation has the stronger pull on yields.
Client Takeaways:
- Long-term hedges: price cancelable swaps. The added cost is modest relative to the protection if rates fall.
- Short-term hedges: execute cap extensions as early as possible and keep terms short. Waiting has been expensive.
- In-the-money swaps: hold them unless the value can fund a better long-term structure.
- New financing: plan for 60–65% leverage and possible buy-downs. Ask lenders directly what they charge on required swaps.
- Rate locks: meet every deadline. Extensions are not being granted.
Data Notes and Sources
- Curve levels are from our Treasury historical yield curve screen (10/5/2026 vs 9/1/2026). The screen shows no 9/1 value for the 4-month bill or the 20-year bond, so their 30-day changes are left out.
- Fed pricing moved fast during the Oct 5 call. A reading of about 85% for October was not current; the desk confirmed October odds had fallen to about 20%. December hike odds were cited at 100% on the call and about 69% by Trading Economics the same morning. Check live pricing before publishing.
- A 2-year yield of about 4.70% was cited on the call; the curve screen shows 4.83% at the close.
- Desk views are from internal calls on September 25 and October 5, 2026. Client examples are anonymized.
- Market data: Trading Economics, US 10-year yield and curve; Trading Economics, Sept 30 multi-decade highs; Trading Economics, 10-year hits highest since 2007; BMO oil and 10-year correlation (via Digg); StockMarketWatch, October 2026 bond report.
This update is market commentary, not investment, legal or tax advice.
Luke Fuller, Director
 Luke Fuller is the Director of Capital Markets at Defease With Ease | Thirty Capital, bringing 10+ years of experience in debt structuring, interest rate risk management, and capital markets execution for CRE investors. With expertise in securitization, derivative hedging strategies, and structured finance, he focuses on optimizing debt portfolios and mitigating market risk through advanced financial modeling and analytics. Luke has extensive experience in CMBS, agency, and balance sheet lending, structuring financial instruments, and executing transactions across multiple asset classes. He has advised investors, private equity firms, and REITs on interest rate derivatives, yield curve analysis, loan restructuring, and portfolio risk assessment.